200MA(期間200の移動平均線)とは?
FXトレードにおいて200MA(期間200移動平均線)の有用性については、このサイトでも何度も述べてきました。
FX関連記事|200MA
- ”おまいら200MA(移動平均線)を入れてみろ!勝率がグンッと上がるぞ!”
- 【FX手法】200MAだけで6年間負け無し!『883手法』を紹介するよ!
- 【FX手法】200MA(移動平均線)の汎用性の高さにそろそろ気付くべき!
- パラボリックSARに200移動平均線(EMA)を引いてみろ、優位性が高まるぞ!
200MAとは期間を200に設定した移動平均線です。
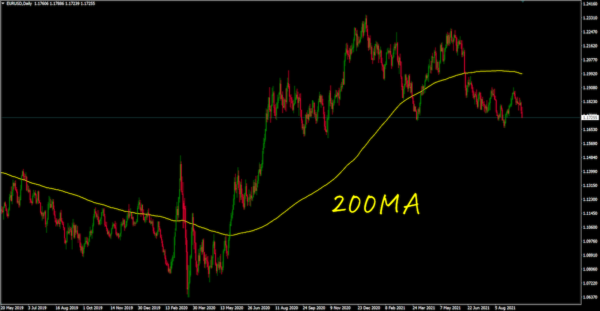
200MA(移動平均線)
長期移動平均線の中でも最も汎用性が高く、利用頻度が多い指標の一つです。SMA(単純移動平均線)やEMA(指数平滑移動平均線)で使用されることが一般的。
【FX】200MAが重要視される理由
相場において200MAが重要視される理由はシンプル。世界中の機関投資家、そして多くのトレーダーが200MAに注目しているからです。
注目されるから重要度が増し、重要度が増すからますます注目される。そのスパイラルによって200MAのプライオリティが高まったわけです。結果、200MAのラインがサポート・レジスタンスラインとしてある程度効くようになりました。
もともとは株式市場で使われ始めた200MA。1年間を通した株価変動を確認するために200MAが最適であると考えられています。1年間における平日の日数はざっくり260日。1年というサイクルに適した数値として200日が使われるようになったわけです。
期間200(日)を提唱したのは、Joseph E.Granville(ジョゼフ・E・グランビル)。彼の著書『Granville’s New Strategy of Daily Stock Market Timing for Maximum Profit』の中で、「200-day line」というワードが何度も登場します。詳しくは以下の記事をお読みください。
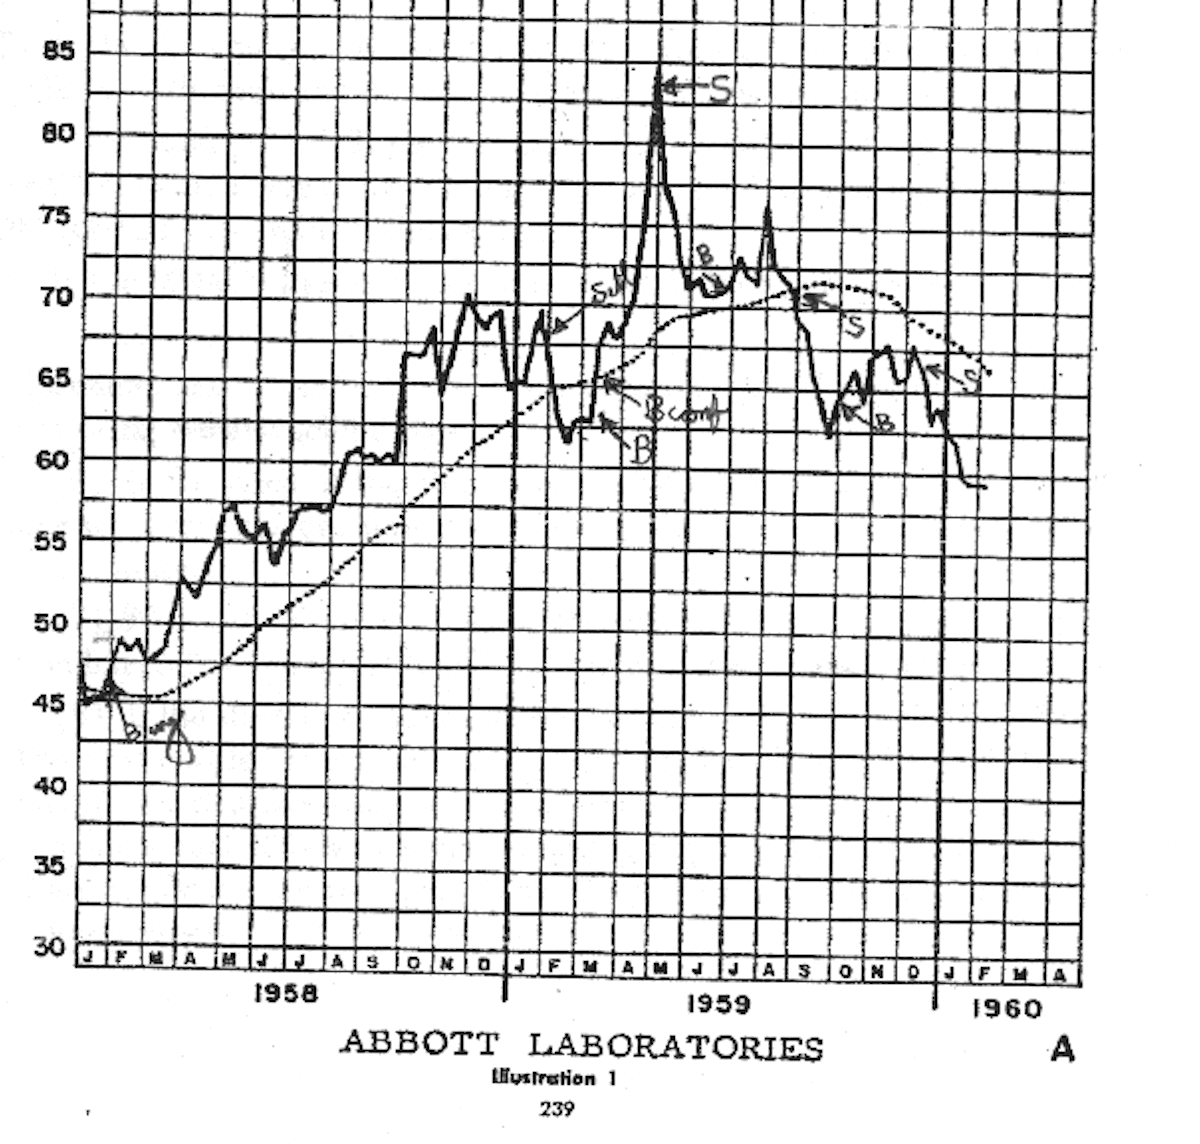
『Granville’s New Strategy of Daily Stock Market Timing for Maximum Profit』からの引用を掲載します。
The stock was a buy in January 1958 at $47 a share as seen by the upside penetration of a bottoming out 200-day line (Buy signal #1). The trader would have sold the stock at $67.50 in late January 1959 on its continuing inability to surpass the November 1958 high of $71, expecting a retraction toward its 200-day line (Sell signal #8). The stock was repurchased at $62.50 in early March 1959 after it had gone under its 200-day linebecause the stock had met support and started to turn up following its downside penetration of a rising 200-day line (Buy signal #2). The stock provided a second buy signal on its upside penetration of the 200-day line at $66 later in March 1959 (Buy confirmation). The stock was again a sale between $82.50 and $85 the end of April 1959 (Sell signal #8). The stock was then repurchased at $72 in June 1959 (Buy signal #3) and sold out at a slight loss at $70 on downside penetration of the 200-day line in August 1959. The stock turns up from support level demonstrated in February 1959 and is repurchased at $64 in September 1959 for technical recovery back toward the 200-day line (Buy signal #4). Failing to reach that line after approaching it at $67.50 in December 1959, the stock is sold at $65, the level breaking the November 1959 support (Sell signal #7).
Recapitulating, the trader (restricting himself to the long side of the market has a $3,900 profit on an initial $4,700 outlay, a percentage gain of almost 83% in less than two years.
Bought Sold Gain Jan 1958 100 shares at 47 Jan 1959 at 67.5 2050 Mar 1959 100 shares at 62.50 April 1959 at 82.5 2000 June 1959 100 shares at 72 Aug 1959 at 70 -200 Sep 1959 100 shares at 64 Dec 1959 at 65 100
Net Gain $3,950
In the above example a very significant point is seen: Because of the guidance provided by the 200-day moving average price Line, the slight 2-point loss on the August 1959 sale was prevented from becoming a bigger loss. While it is always sound advice to tell somebody to let their profits run and cut their losses short, this is often easier said than done, human nature dictating the frequent taking of profits but the infrequent taking of small losses This allows small losses to often run into big losses.
granville
文中で200-day lineが何度も登場していますが、これが200日移動平均線です。200日移動平均線(200MA)を基準に株価が乖離と収束を繰り返している様子を解説しています。
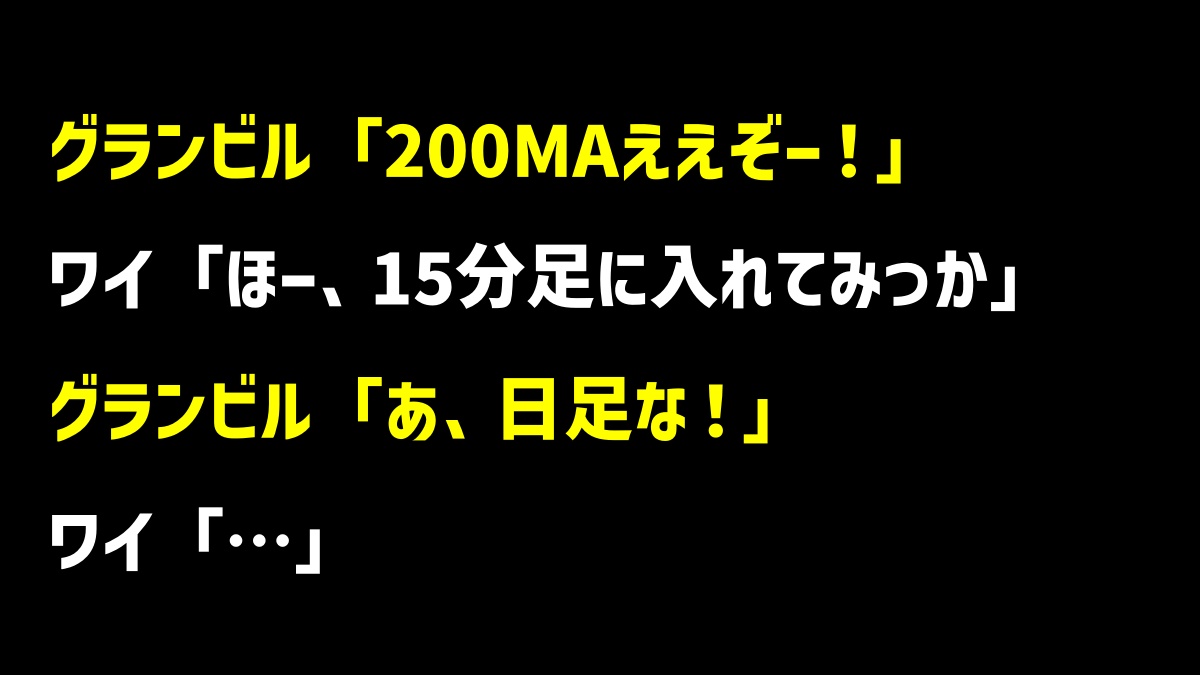
グランビル「200MAええぞー!」ワイ「ほー、入れてみっか」グランビル「あ、日足ね!」ワイ「…」
教えて!グランビルの法則の移動平均線は何日が正しいの?の中でも解説しましたが、200MAの真の正体は「200-day line」です。
つまり200「日」の移動平均線です(=200Day_MA)。日足をベースにした移動平均線が基本だったわけです。日足チャートに描写した200MAこそ本来の200MAの姿です。
短期足、たとえば5分足に200MAを表示させたところで、1000分…つまり過去17時間程度の動きを平均化したにすぎません。1分足に200MAを表示させれば、たったの200分=3時間20分の動きを平均化しただけとなります。
もちろん短期足に表示させた200MAが全く意味がないとは言いません。結局のところ、どれだけ多くの人に注目されているかどうかによってテクニカルが効いてくるわけなので…。世界中のトレーダーが5分足や15分足に200MAを表示させているならば、有効度は高まります。
ただ、200MAを正しく使いたいならば、日足に表示させるべきです。なぜなら日足に表示させているトレーダーが圧倒的に多いからです。
多くの海外FXサイトをチェックすれば一目瞭然ですが、200MA(移動平均線)が最もフォローされている長期指標の1つであることは間違いありません。
長期的なトレンドを判断する指標として最もシンプルかつ有用性が高いと認識されているのが200MA。そして200MAは、必ず日足ベースです。
この事実を知っておくことは大切です。短期足(1分足や5分足、30分足など)に200MAを表示させることを否定しているわけではありませんが、少なくとも200MAの本質は日足である点は理解しておく必要があります。
【2026年1月版】優位性の高いFX商材 Best4
200MAの上では「買いのみ」、下では「売りのみ」
日足に表示させた200MAを基準に考えれば、トレードはシンプルになります。
- 200MAの上では買いトレードのみをおこなう
- 200MAの下では売りトレードのみをおこなう
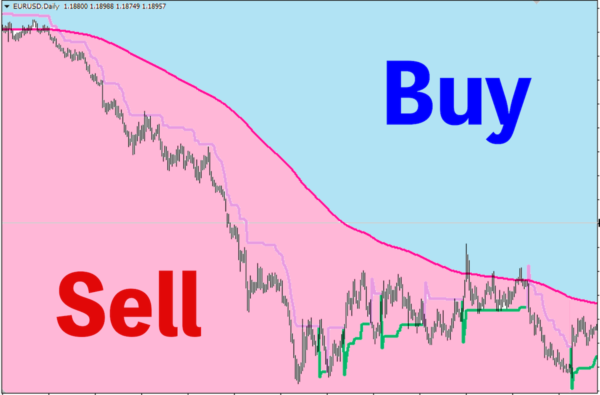
Supertrendを活用した順張りストラテジーを考察するよ!
レートが200MA(日足)の上にある時は、買い場を探します。
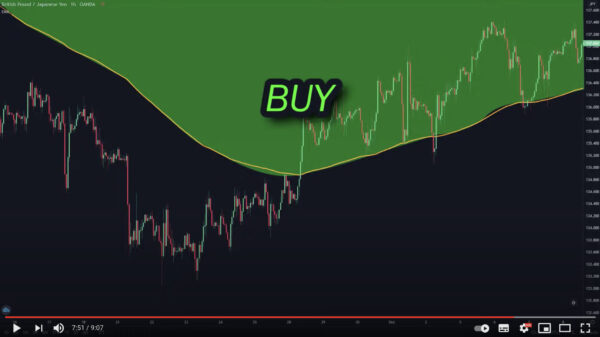
200EMAの上サイドは買いゾーン
レートが200MA(日足)の下にあるときは、売り場を探します。
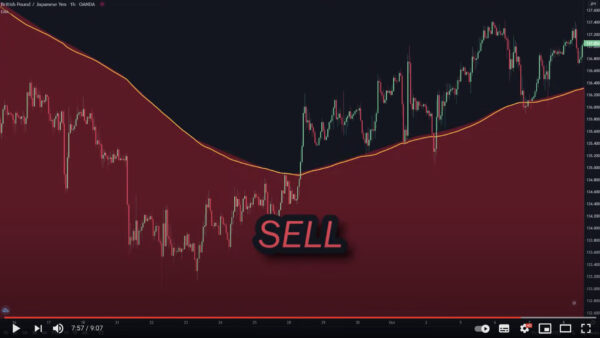
200EMAの下サイドは売りゾーン
日足200MAを活用することで、トレードの指針(方向性)が簡単に判断できます。
200MAを基準にして、買い場・売り場を探すための指標(テクニカル)を加えれば、ストラテジーの完成です。


