
もはや定番と化した”グランビルの法則”だけど…
最も有名な相場の基本法則といえば、誰もが知っているグランビルの法則です。もはや疑う余地すらありません。
初心者向けFX書籍を開けば、必ず紹介されているほど定番化していますよね。
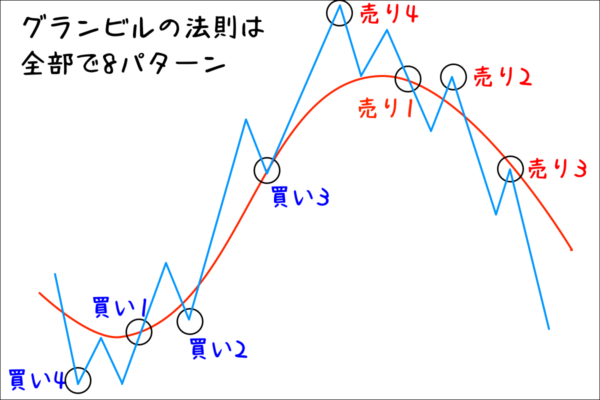
グランビルの法則は全部で8パターンある
ご存知のようにグランビルの法則には売り買い共に4つのパターン(計8パターン)が存在します。
買いの4パターン
- 買い1…移動平均線上昇中の上抜け
- 買い2…移動平均線上昇中の「押し目」(移動平均線を割る)
- 買い3…移動平均線上昇中の「押し目」(移動平均線を割らない)
- 買い4…移動平均線から下方へ大きく乖離からの収束を狙う
売りの4パターン
- 売り1…移動平均線下落中の下抜け
- 売り2…移動平均線下落中の「戻り」(移動平均線を割る)
- 売り3…移動平均線下落中の「戻り」(移動平均線を割らない)
- 売り4…移動平均線から上方へ大きく乖離からの収束を狙う
”グランビルの法則”に使われる移動平均線は「何日」が正解?
グランビルの法則は、移動平均線とレートとの位置関係(乖離や収束)から、レートの先行きを予測するテクニカルとして知られています。
ところで、ベースとなる移動平均線の正しい期間って、何日なのでしょうか?あなたは知っていますか?
ネット上では、グランビルの法則に使われた移動平均線の期間について、200だったり20だったり50だったりと、バラバラです。
期間200が用いられることが正しいなどと解説しているサイトもありますが、そのエビデンスはどこにも掲載されていません。
提唱者のグランビルは、実際のところ移動平均線期間を何日で推奨していたのか?今回は、そのエビデンスを探してみたいと思います。
【2026年1月版】優位性の高いFX商材 Best4


『Granville’s New Strategy of Daily Stock Market Timing for Maximum Profit』から読み解く
Joseph E.Granville(グランビル氏)が、いわゆる「グランビルの法則」を提唱したのは、彼が1960年代に出版した『Granville’s New Strategy of Daily Stock Market Timing for Maximum Profit』の中であるとされています。

日本語訳も出版されていますが、現在は古本でしか購入できないようです。

この古本はなんと、21,000円もします!なかなか手が出せないですね。
さて、原書である『Granville’s New Strategy of Daily Stock Market Timing for Maximum Profit』を紐解いてみましょう。
まず、大前提として『Granville’s New Strategy of Daily Stock Market Timing for Maximum Profit』は株式市場の分析のための解説本であることを知っておく必要があります。株式とFXではそもそも動きが異なるわけですから、その点は考慮しておくべきですね。
とはいえ、グランビルの法則はマーケット参加者の大衆心理をベースにしているので、ある程度は同じような動きをするのではないかと推測されます。
とある海外サイトにて、原書からの引用と思われる箇所を見つけましたので紹介します。
The stock was a buy in January 1958 at $47 a share as seen by the upside penetration of a bottoming out 200-day line (Buy signal #1). The trader would have sold the stock at $67.50 in late January 1959 on its continuing inability to surpass the November 1958 high of $71, expecting a retraction toward its 200-day line (Sell signal #8). The stock was repurchased at $62.50 in early March 1959 after it had gone under its 200-day line because the stock had met support and started to turn up following its downside penetration of a rising 200-day line (Buy signal #2). The stock provided a second buy signal on its upside penetration of the 200-day line at $66 later in March 1959 (Buy confirmation). The stock was again a sale between $82.50 and $85 the end of April 1959 (Sell signal #8). The stock was then repurchased at $72 in June 1959 (Buy signal #3) and sold out at a slight loss at $70 on downside penetration of the 200-day line in August 1959. The stock turns up from support level demonstrated in February 1959 and is repurchased at $64 in September 1959 for technical recovery back toward the 200-day line (Buy signal #4). Failing to reach that line after approaching it at $67.50 in December 1959, the stock is sold at $65, the level breaking the November 1959 support (Sell signal #7).
Recapitulating, the trader (restricting himself to the long side of the market has a $3,900 profit on an initial $4,700 outlay, a percentage gain of almost 83% in less than two years.
Bought Sold Gain Jan 1958 100 shares at 47 Jan 1959 at 67.5 2050 Mar 1959 100 shares at 62.50 April 1959 at 82.5 2000 June 1959 100 shares at 72 Aug 1959 at 70 -200 Sep 1959 100 shares at 64 Dec 1959 at 65 100
Net Gain $3,950
In the above example a very significant point is seen: Because of the guidance provided by the 200-day moving average price Line, the slight 2-point loss on the August 1959 sale was prevented from becoming a bigger loss. While it is always sound advice to tell somebody to let their profits run and cut their losses short, this is often easier said than done, human nature dictating the frequent taking of profits but the infrequent taking of small losses This allows small losses to often run into big losses.
granville
引用中の画像は、Abbott Laboratories(アボット・ラボラトリーズ 米国の製薬会社)の株価チャートです。世界初のHIVES血液検査薬を開発したことでも知られているグローバル企業ですね。創業はなんと1888年です。
Joseph E.Granville(グランビル氏)がAbbott Laboratories(アボット・ラボラトリーズ)の株価チャートを、グランビル法則に基づいて解説している文章ですね。
さて、ご覧の通り、文中には何度も「200-day line」というフレーズが出てきます。
つまり期間200日の移動平均線です。
グランビルの法則は、期間200日移動平均線がベースになっていることがわかります。ただ、あくまでも株式市場を元にした分析なので、当然日足が基本です。
まとめ:グランビルの法則に使われる移動平均線は200日が正しかった…
彼の原書『Granville’s New Strategy of Daily Stock Market Timing for Maximum Profit』から、グランビルの法則を提唱した本人は、期間200日(日足)をベースにしていた…ということがわかりましたね。
とはいえ、グランビルの法則はもともと株式チャート分析のための法則であることを理解しておくことが大切です。
それを踏まえた上で、FXトレードに応用するべきですね。